Real-time Insights
The Dagster+ Observability update includes the next-generation version of Dagster+ Insights with the following improvements:
- New insights views to help you understand trends
- New KPI dashboard to help you understand platform health
New insights views
New insights views help you understand trends in a selection of assets using the new asset health metrics.
To access these views, either click Insights in the left sidebar, or navigate to a selection of assets in the Asset Catalog, then click Insights in the top navigation bar in the UI:
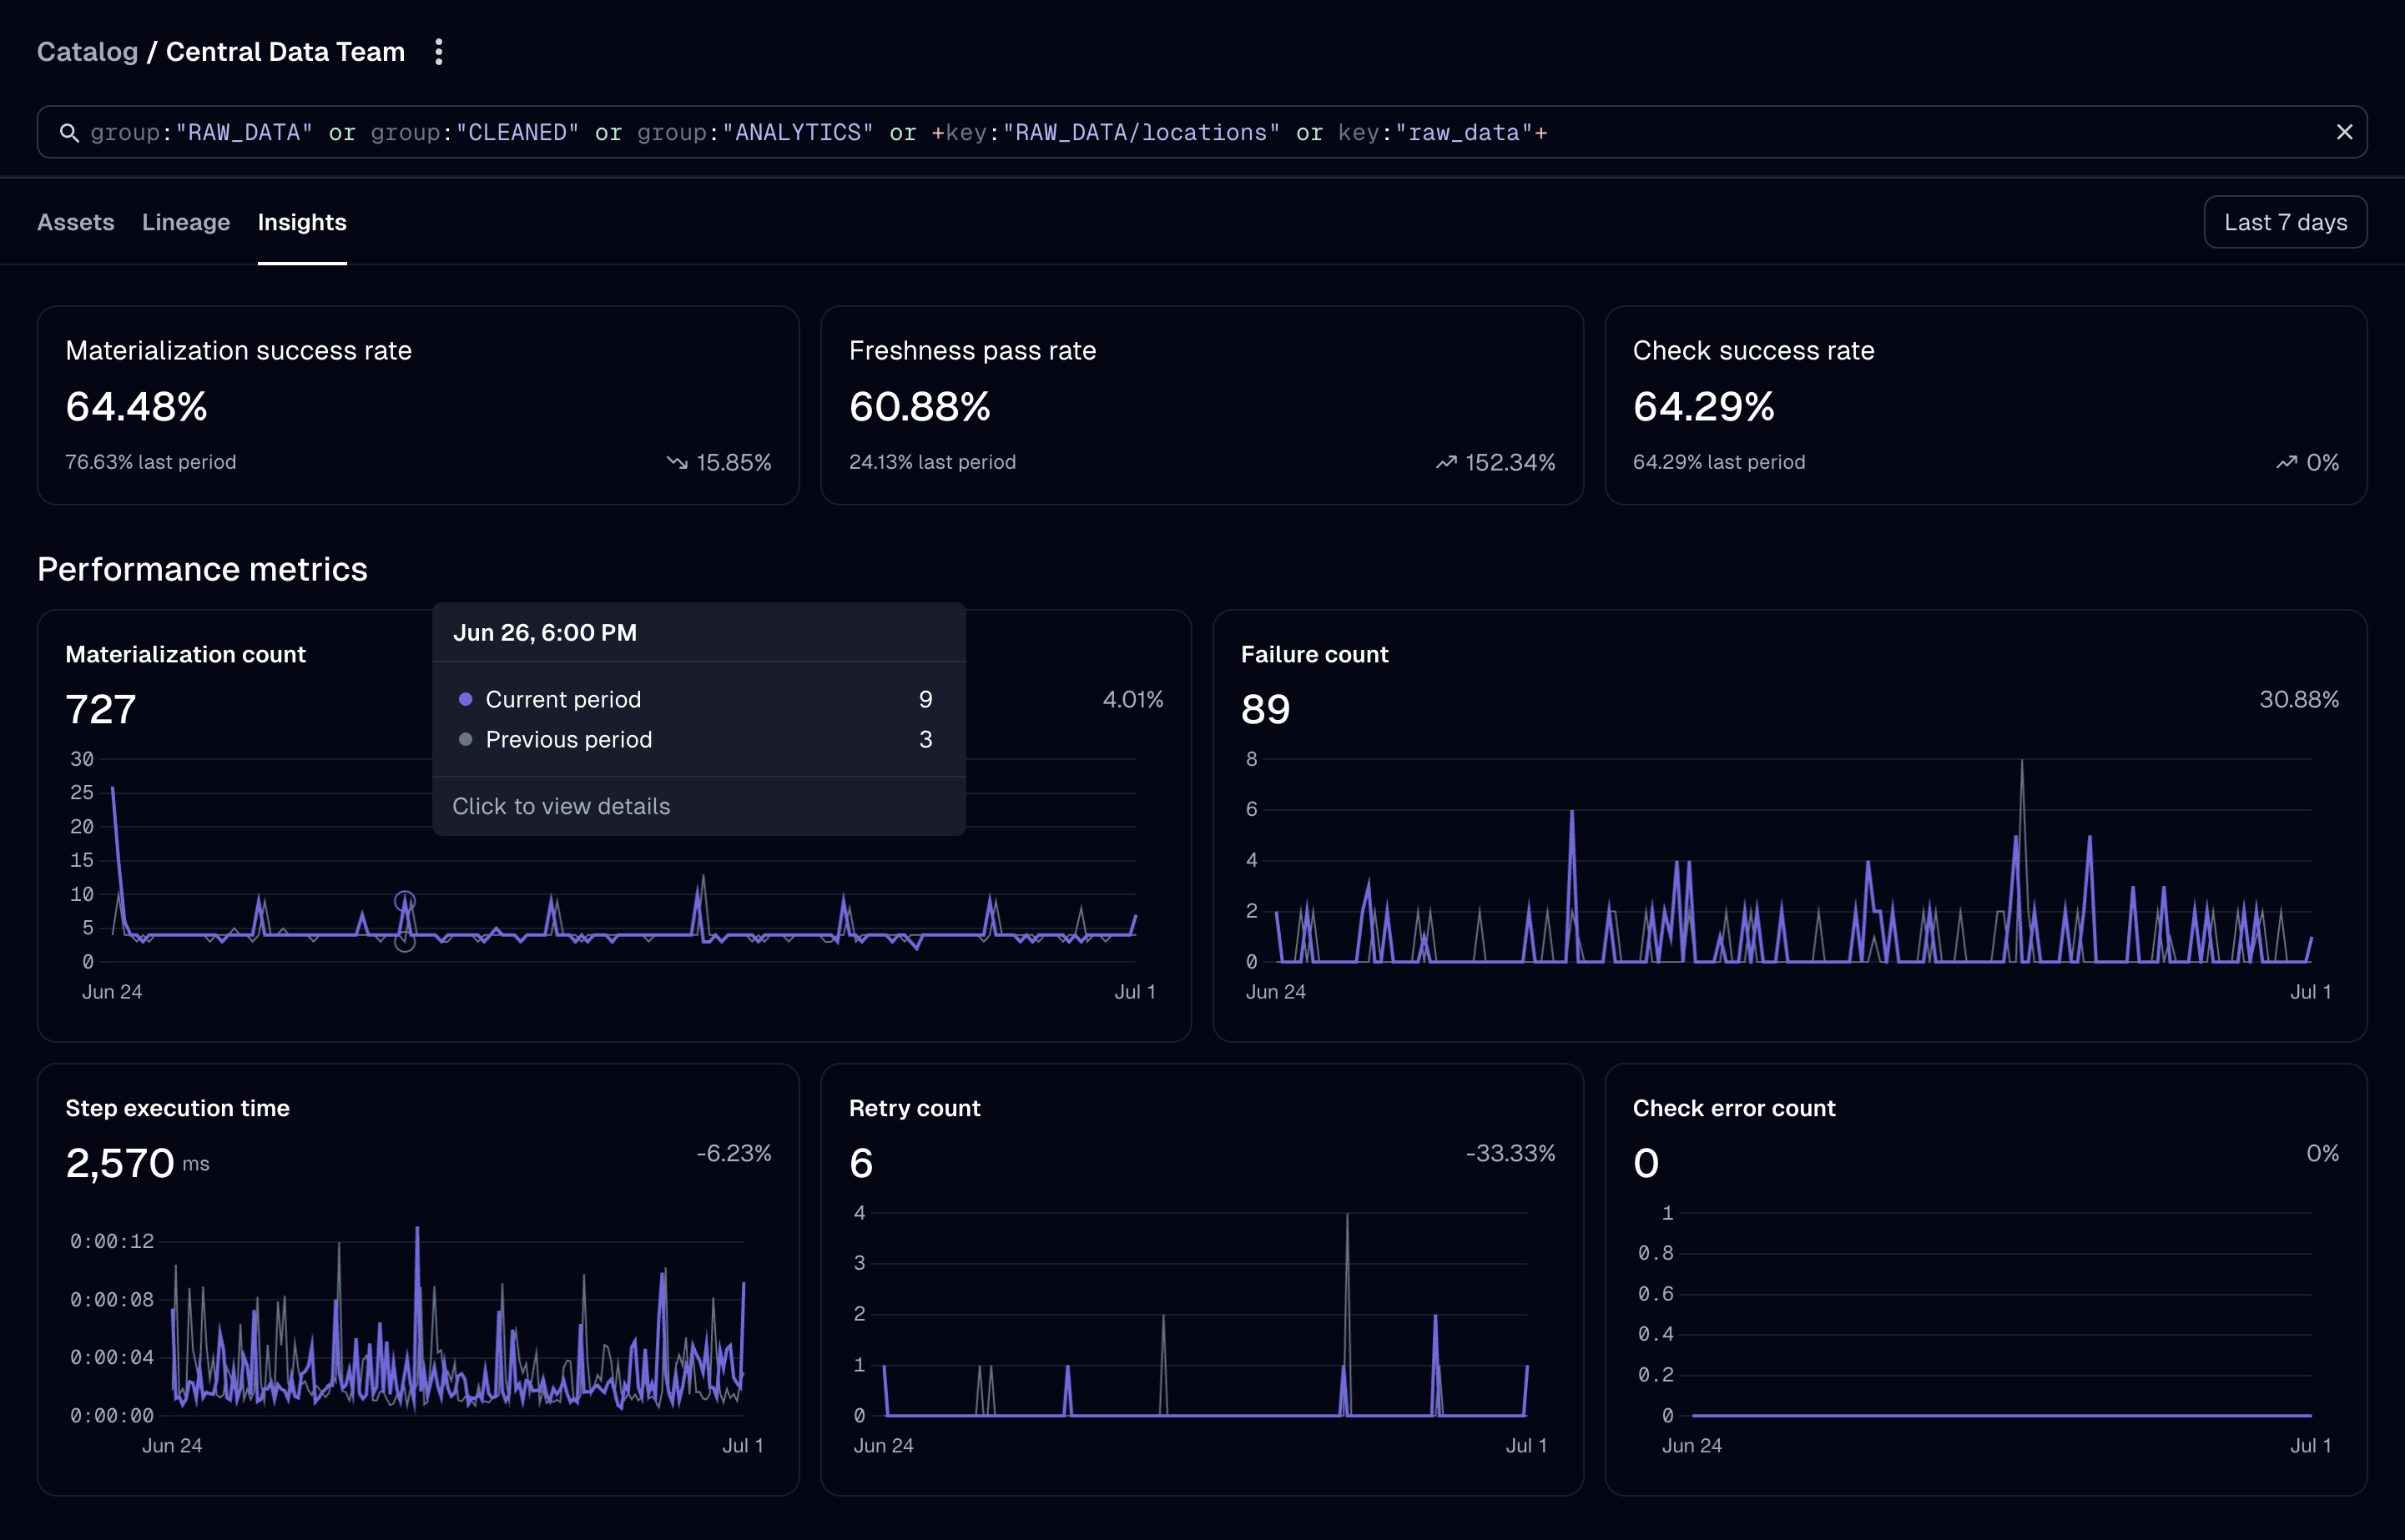
Key asset health metrics, like materialization and failure count, are prominently displayed. To scope the view to a specific set of assets, type an asset selection in the search bar. Or, to view specific events in a time slice, click a datapoint in the line chart.
The insights view also features activity charts that group events by hour to help you understand scheduling and automation behaviors:
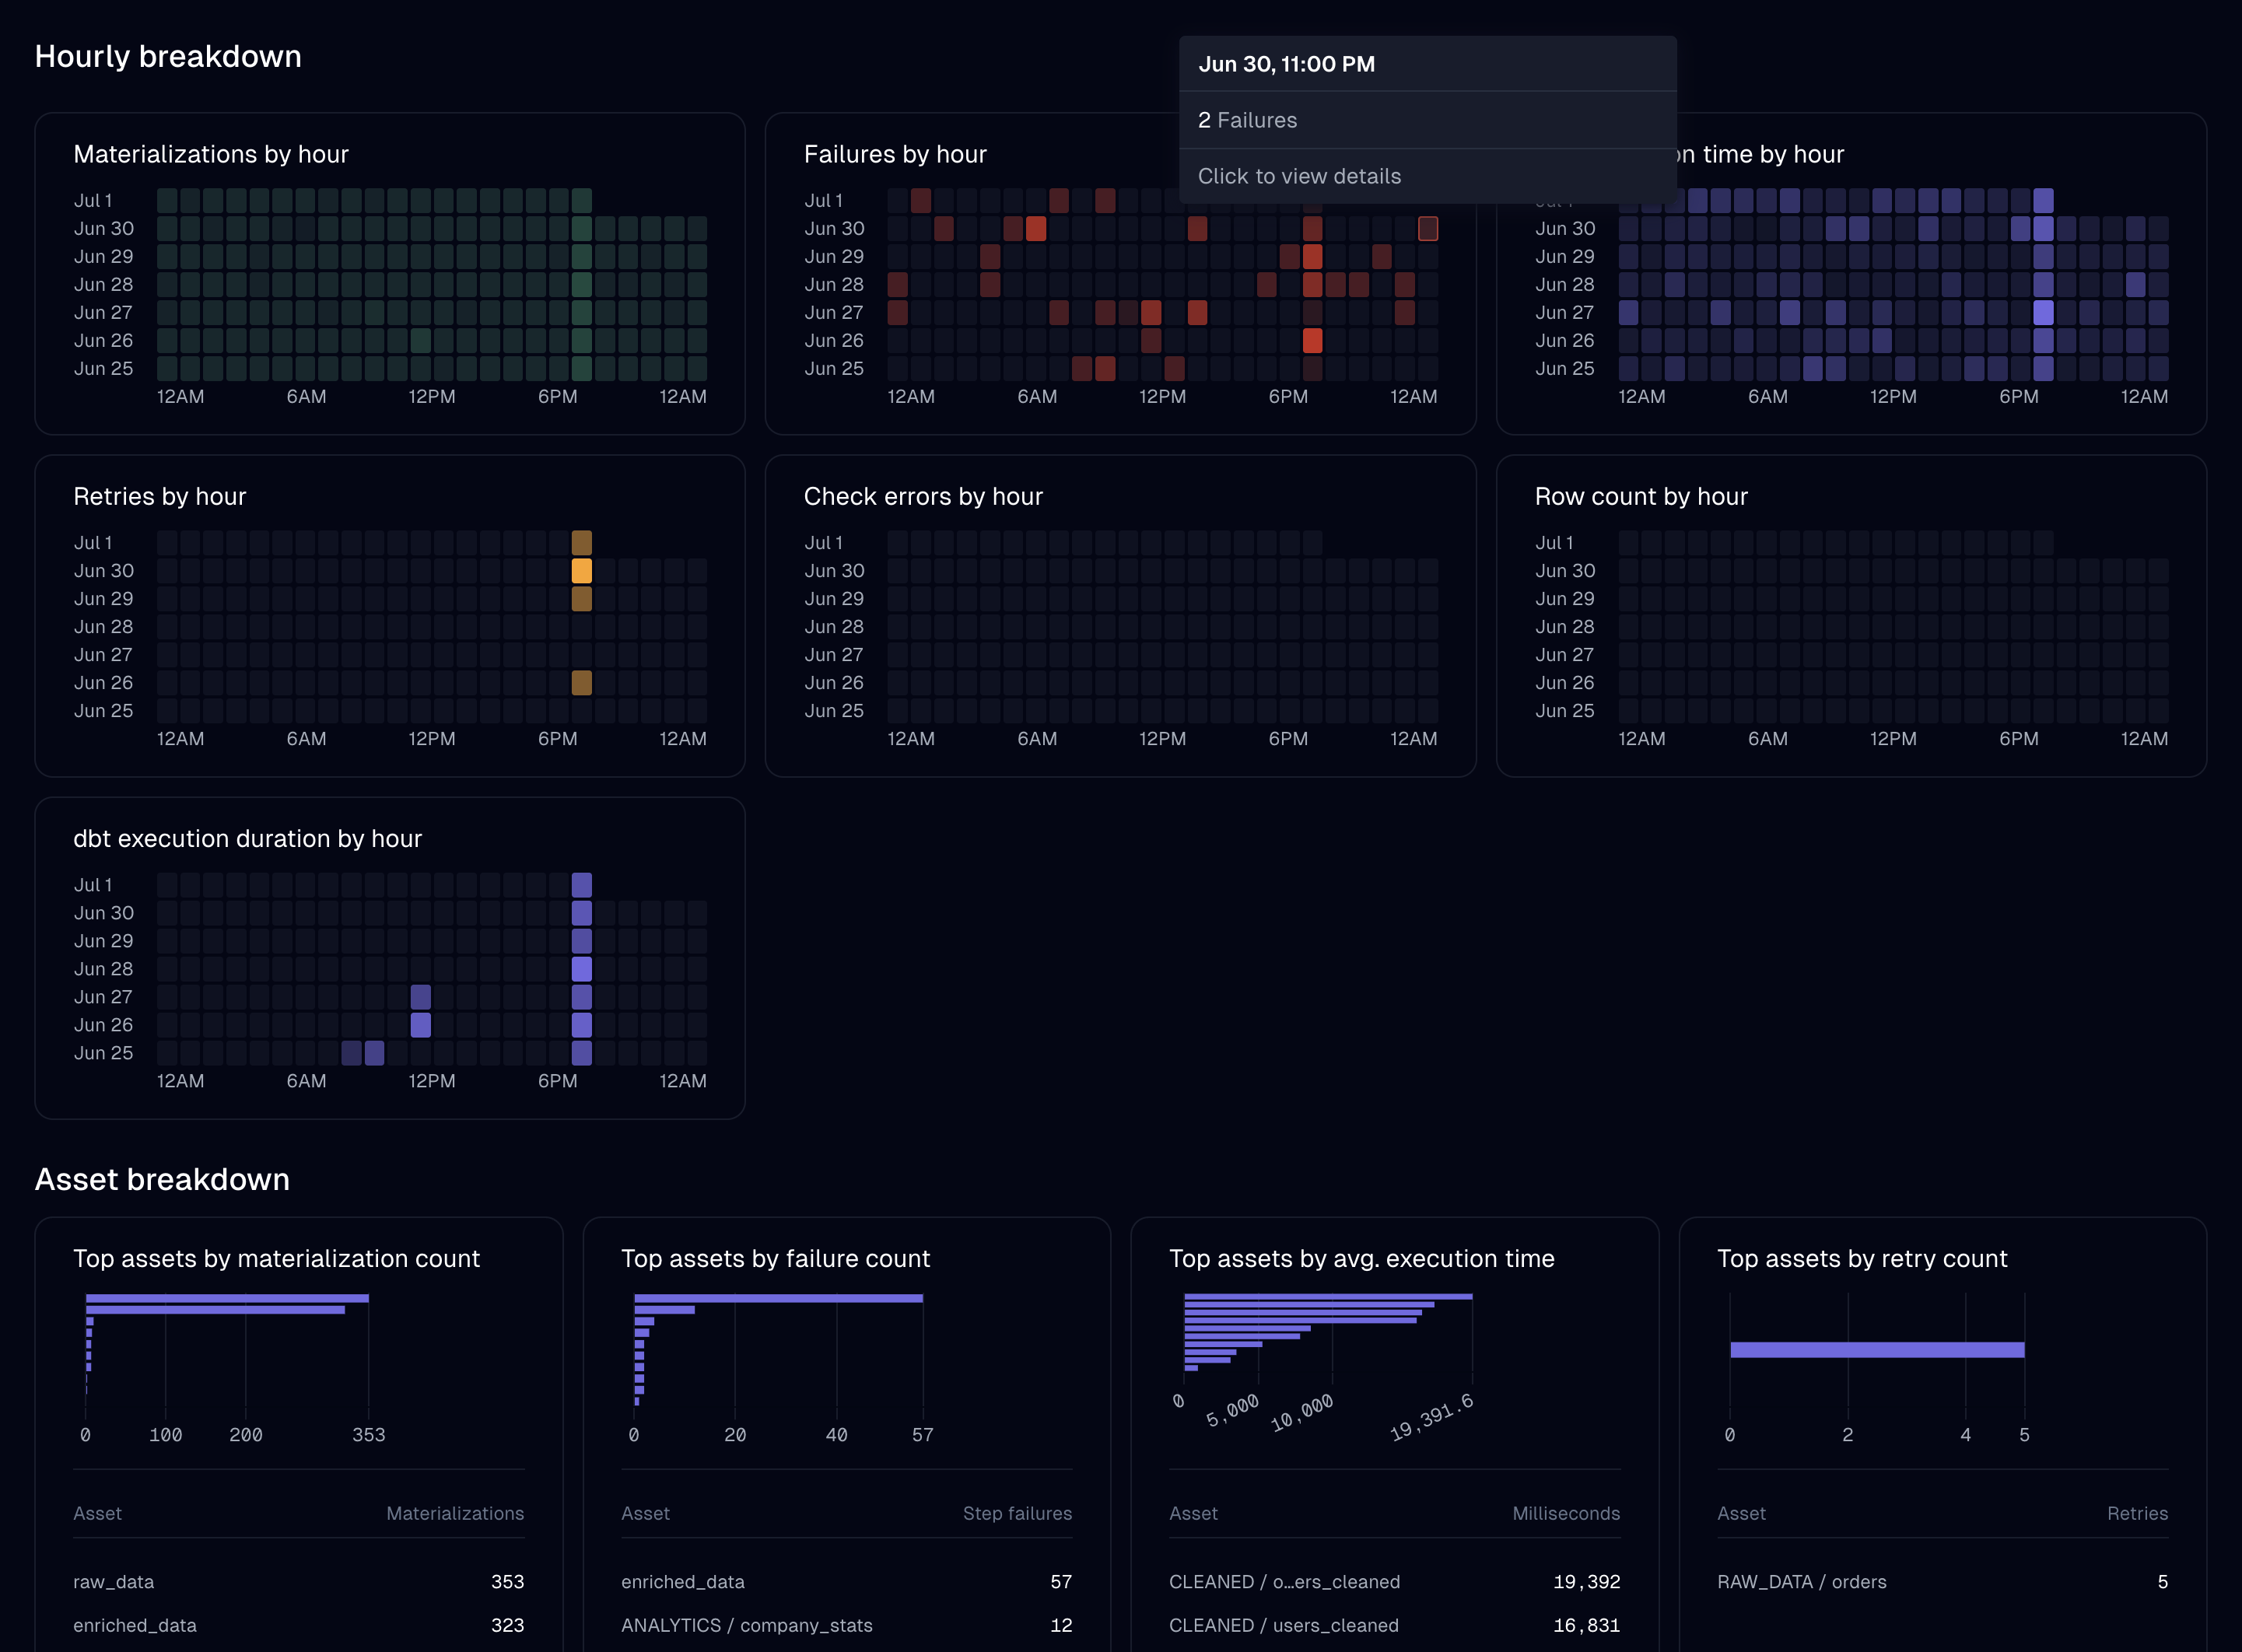
Events now stream back to insights views in real time. Insights views show metrics bucketed by hour through the last 120 days.
New KPI dashboard
The new KPI dashboard helps you understand platform health across saved asset selections. To access it, click Insights in the left sidebar, then navigate to the Trends tab:
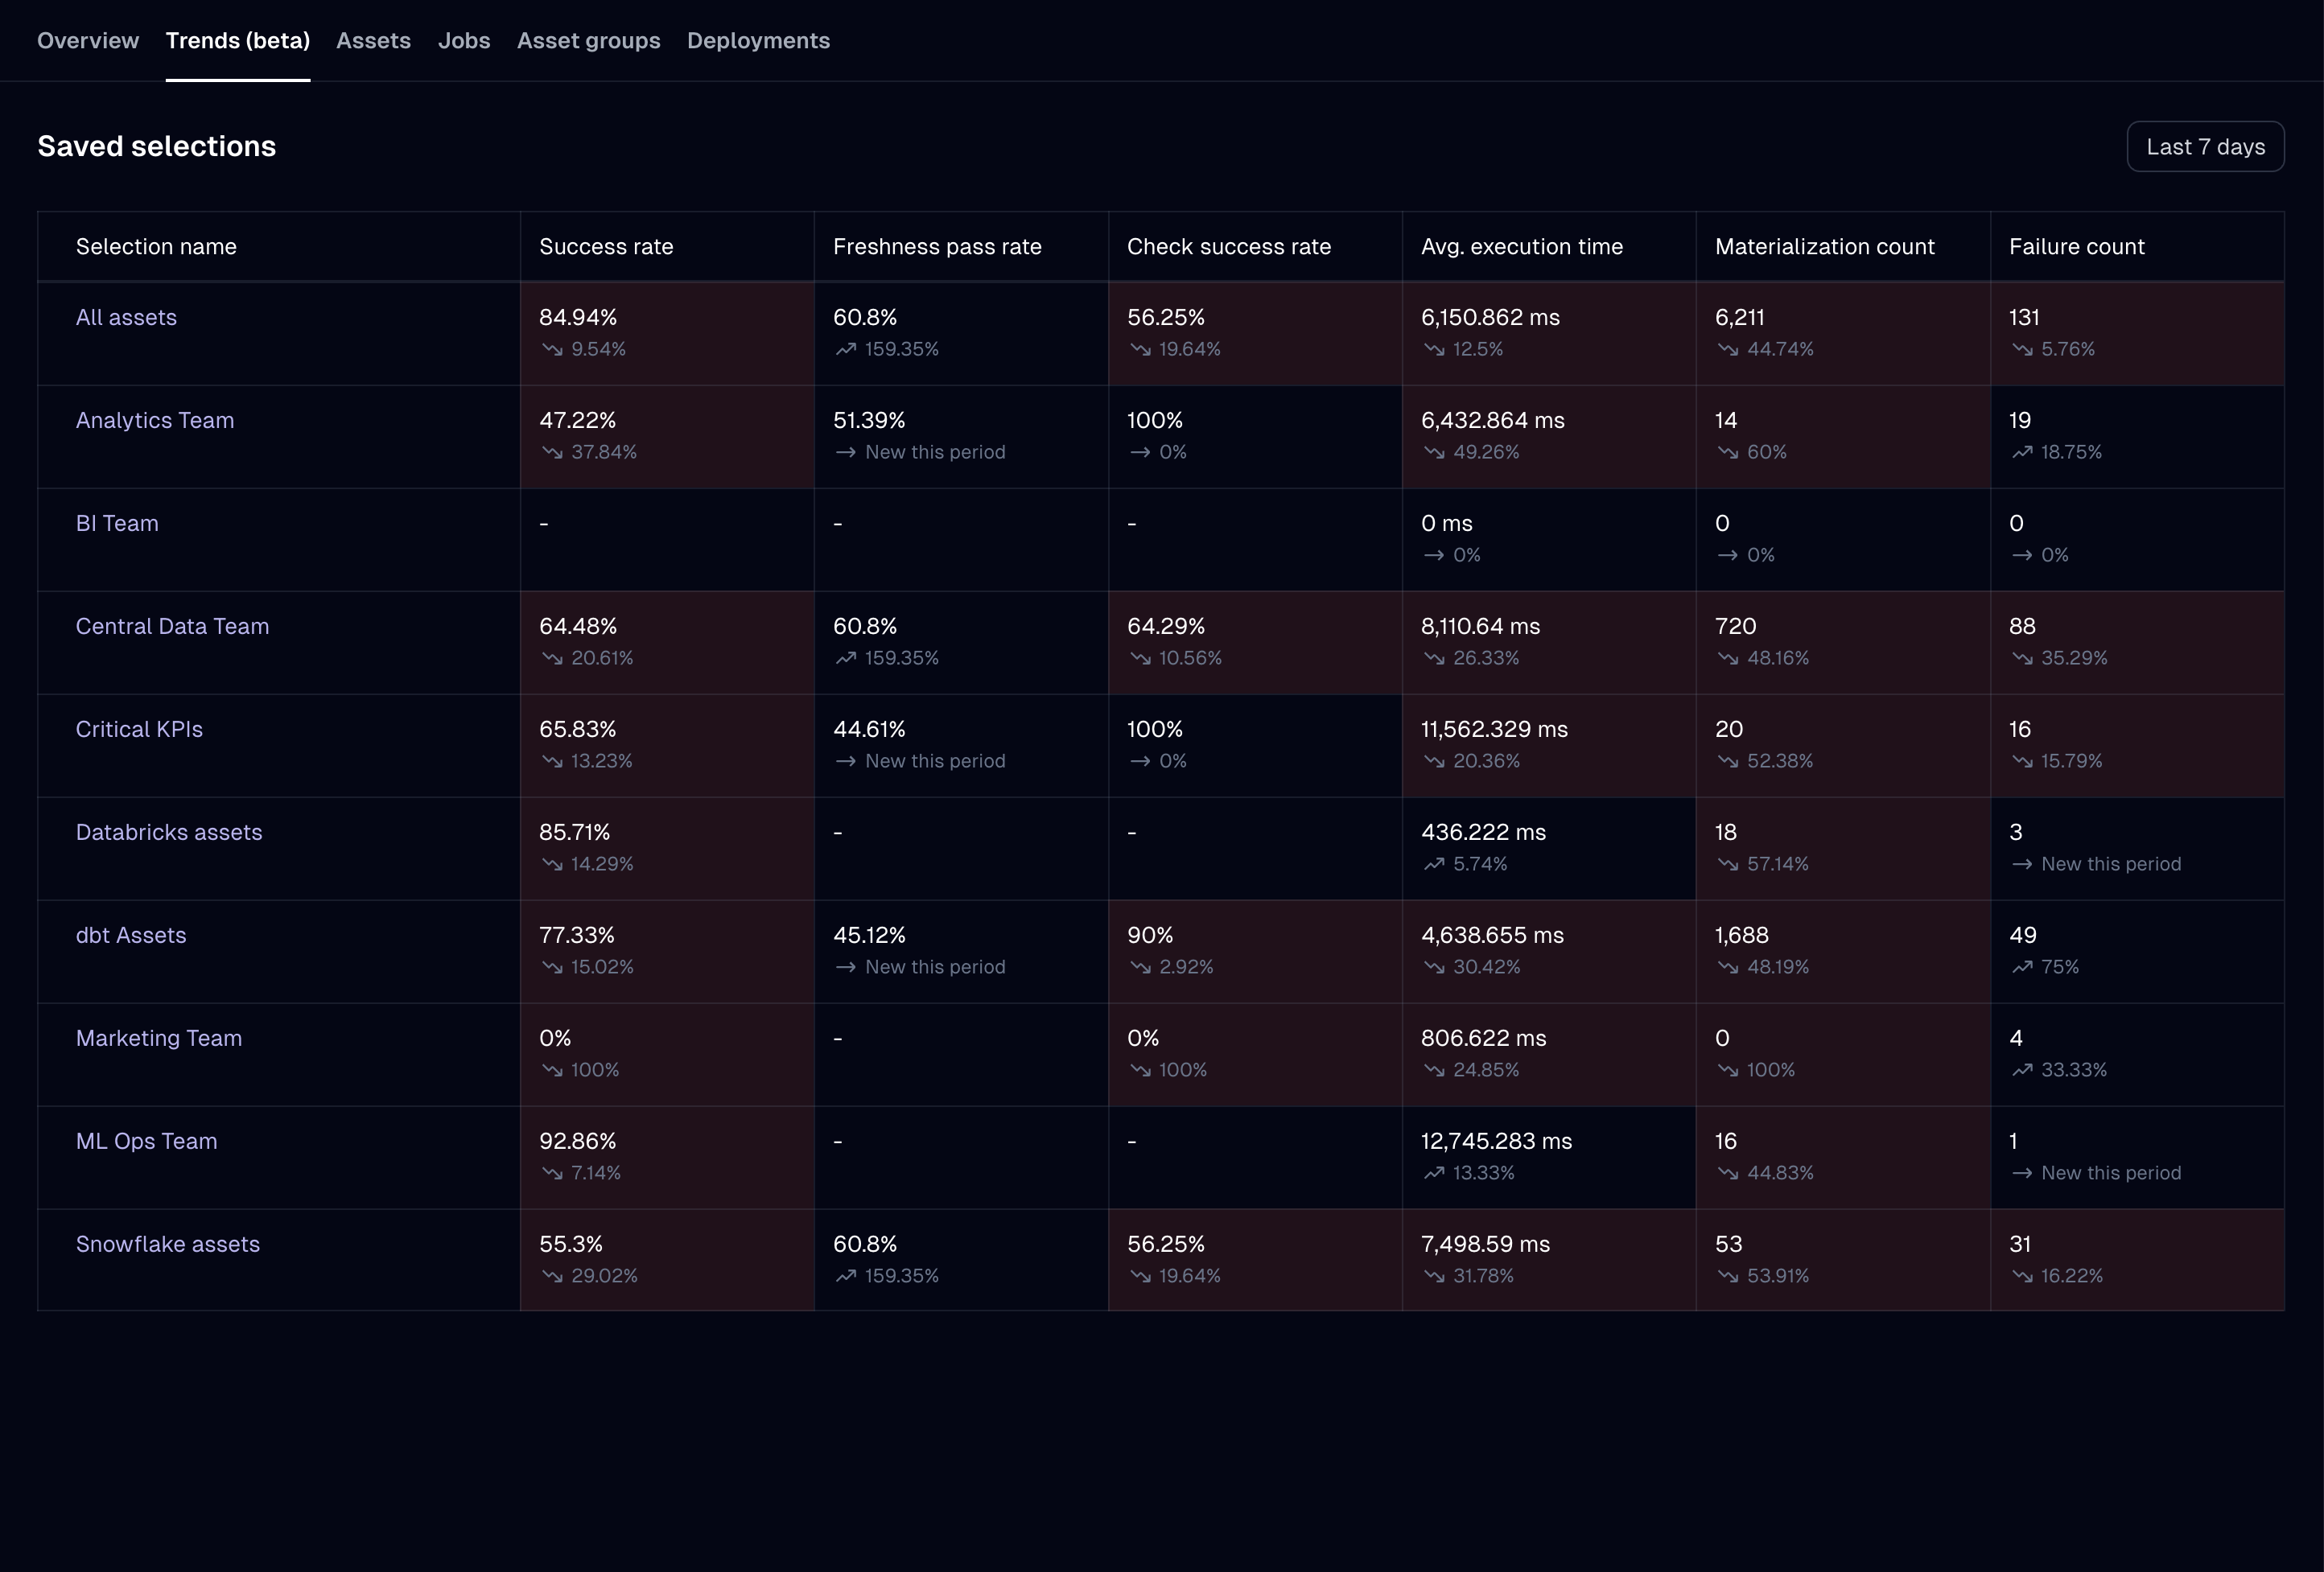
KPIs allow you to understand your platform health at a high level, and compare metrics from different saved selections.
New asset health metrics
Insights views will continue to display existing built-in metrics alongside new asset health metrics:
| Metric | Description |
|---|---|
| Materialization success rate | Percentage of successful executions. |
| Avg. time to resolution | Duration an asset spent in a failed state before materializing. |
| Freshness pass rate | Percentage of time an asset was fresh. |
| Check success rate | Percentage of successful check executions. |
| Materialization failure count | Number of times an asset failed to materialize. |
| Freshness warning and failure counts | Number of times an asset entered a degraded freshness state. |
Known limitations
Since this functionality is still under active development, there are a few limitations we aim to address in upcoming releases:
- Health statuses don’t yet take asset observations into account, only materializations
- Failure events and metrics based on them (time to resolution, materialization success rate, and materialization failure count) will not exist prior to the introduction of the new asset metrics
- Insights views do not currently show cost, Dagster credits, and metadata metrics
- The new pages are all asset-focused, and haven’t yet been implemented for jobs